
List Manager can be viewed in various ways by switching between the four icons at the bottom of the screen. Each view shows data based on the list selected on the left side, and the Column Set selected at the top.

The Standard List View is the default way to view stocks in List Manager. Stocks are listed by line and organized with various customizable columns.
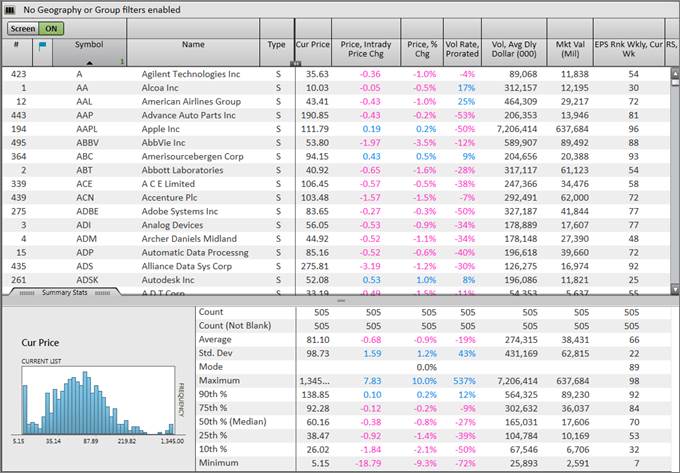
Summary Stats calculate statistics for each column metric in a list, and provide a bar graph representing data frequency for each metric.

To view/minimize the Summary Stats, click the gray tab.

Summary Stats Bar Graph
To view a bar graph of a specific column’s data, click on the column in the Summary Stats section. Each bar represents the frequency with which that data value appears in the selected list.
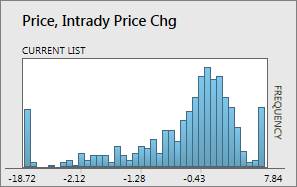
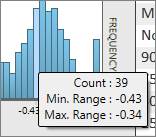
Hover the cursor over a bar to see more details on the count, minimum, and maximum range.
Double-click on a bar to view a list of the stocks that fall within that bar’s specified range. The Summary Stats and bar graph will also update to reflect this new list.
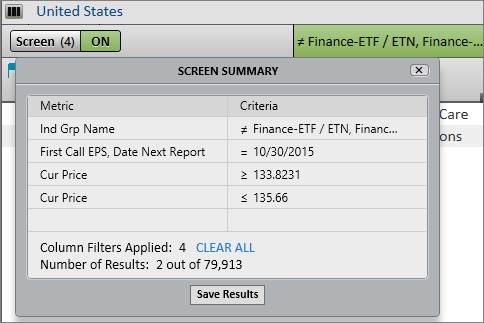
To clear the bar graph-filtered results, click the SCREEN ( ) button and select “Clear All”:

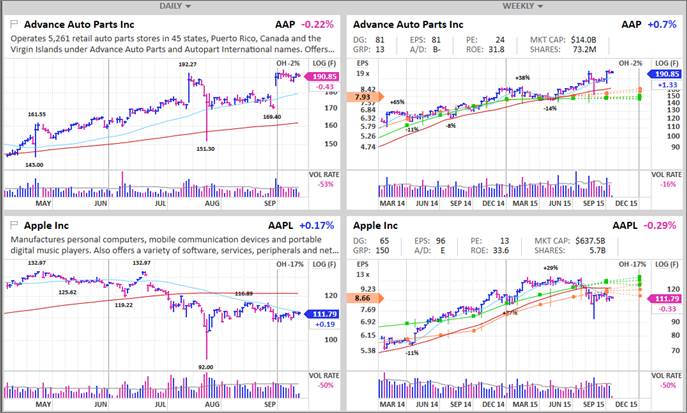
Multi-Charts display a series of miniature Datagraph charts on one screen.
Customizing the Matrices
Click the up-down arrow next to the multi-chart icon to customize the matrix of charts
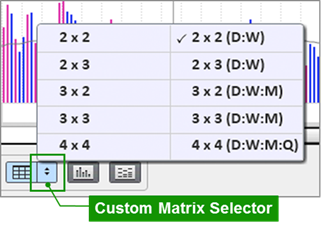
Interval format is “column” x “row”. For example, selecting “3 x 2” displays three columns and two rows of graphs:
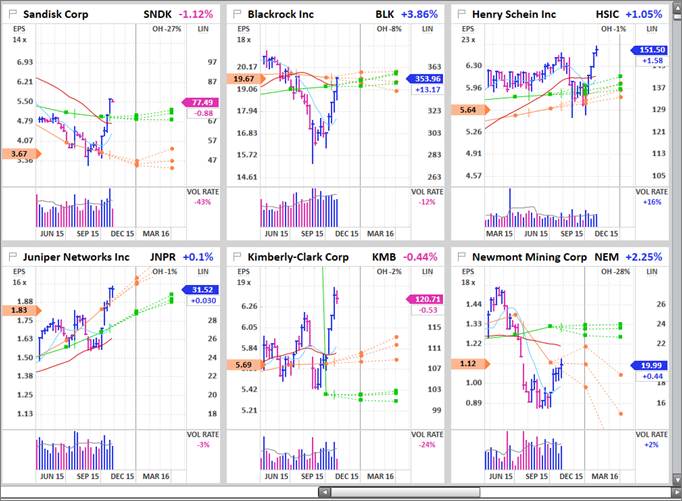
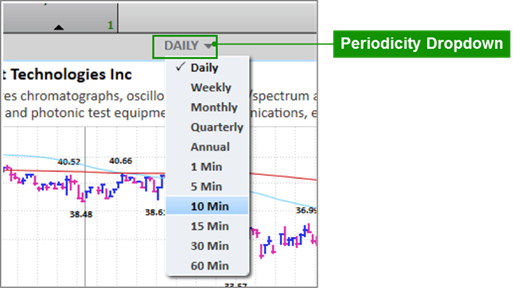
Customize chart intervals even further by clicking the periodicity dropdown at the top of each column of charts.
View Symbol
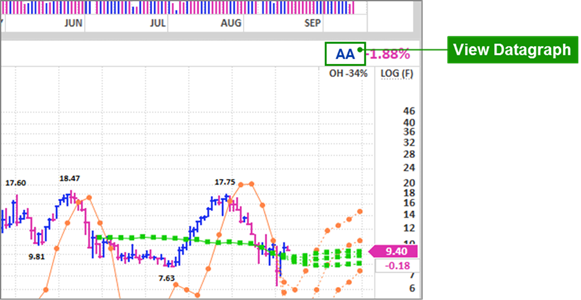
Click the stock symbol located at the top right of a mini-chart to view a full Datagraph chart in Symbol view.
Flagging Stocks
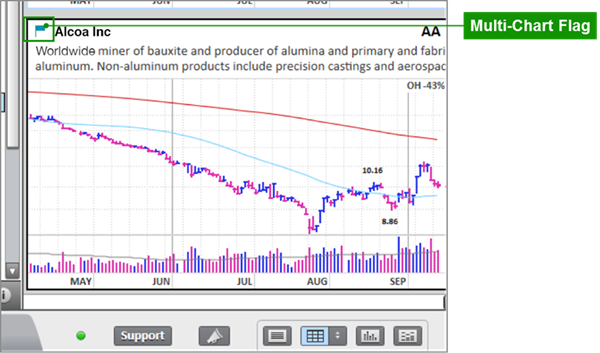
Click the flag icon next to the company name to flag a stock to remember or review later. Flagged stocks are compiled in Smart Lists under Flagged Symbols.

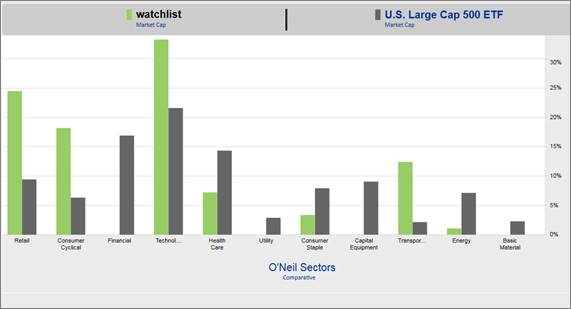
List Analytics compares a list to a benchmark based on sectors, market capitalization, or region.
Select a Benchmark and Weight
Click the blue graph header to choose a benchmark to compare the list to.
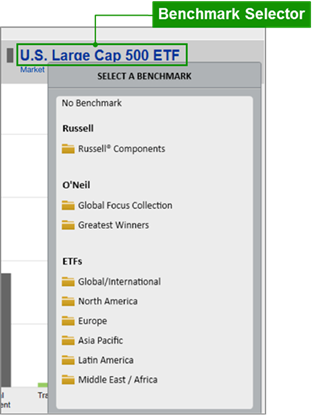
Access to the Russell® Components and the O’Neil Global Focus Collection requires separate entitlements. Please contact William O’Neil + Co. Client Services more information.
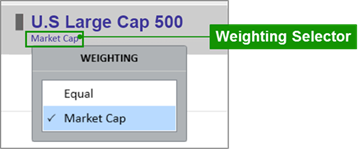
Click the small blue text under the header to choose between seeing the list or benchmark as Market Cap-weighted or Equal-weighted.
Select Grouping and Graph Type
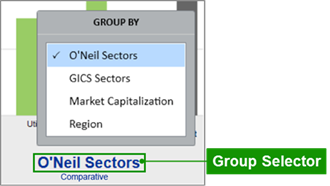
Click the blue footer to choose whether to group the two lists by Sector (O’Neil or GICS®), Market Capitalization, or Region.
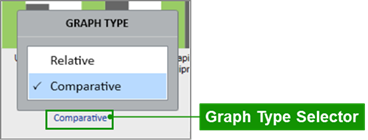
Click the small blue text under the footer to choose between a Relative graph type and a Comparative graph type.
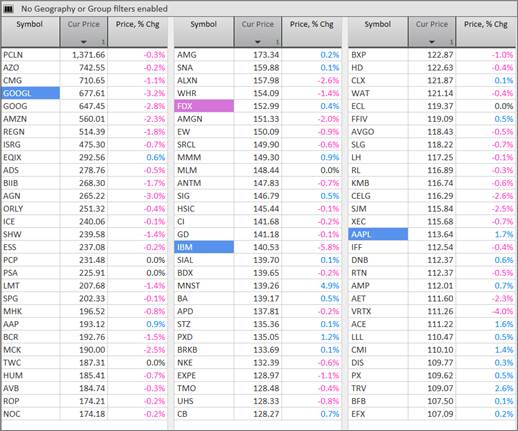
With Nasdaq BasicSM Real-Time quotes selected, the Quote Board highlights upticks in blue and downticks in pink. Click on the stock symbol to view the Datagraph chart in Symbol View. Click on other data in a row to display the symbol in Quick Quote
Quick Quote
Quick Quote gives a brief snapshot of a stock’s current price and volume action.

Use the ticker search box in Quick Quote to look up stocks and get fast, easy quotes.
Click the flag icon to flag a stock for later review.
Click the small Datagraph icon to view the stock’s Datagraph chart in Symbol view.
Click the EPS report date to toggle between the date of the next report and the days until the next report.
Click the Industry Group name to toggle between viewing the O’Neil Industry Group and the GICS® (Global Industry Classification Standard) Sub Industry.
Click the symbol type to toggle between viewing the corresponding SEDOL Masterfile®, Bloomberg ™ symbol, ISIN, or Thomson Reuters ™ symbol.
SEDOL Masterfile® is a registered trade mark of the London Stock Exchange Group Plc
Add Columns
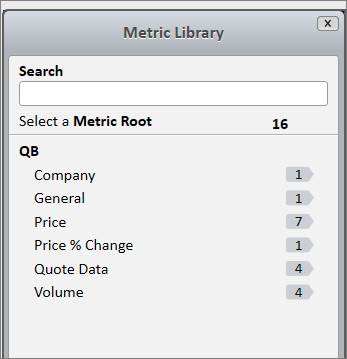
Click Add Columns in the top right corner to add data metrics to the Quote Board. All lists will show the same Quote Board column configuration.

Auto Sort
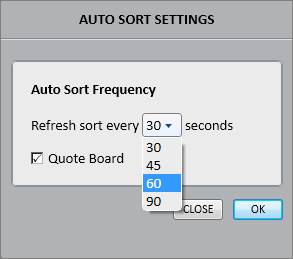
Quote Board can be automatically refreshed over different auto sort frequencies.
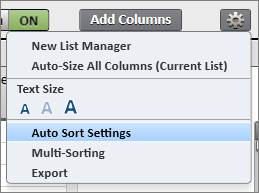
To edit auto sort settings, click the gear icon in the top right corner of the screen, and click Auto Sort Settings
Place a checkmark next to Quote Board to apply the settings to the Quote Board. The Quote Board defaults to refreshing the sort every 30 seconds. Click the dropdown arrow to set a different auto sort frequency.
