
List Manager contains the comprehensive PANARAY Databases: the O’Neil Database and the Ownership Database. These databases are further organized through preset or customized Lists and Column Sets.
Access List Manager by clicking the Lists icon at the bottom left of the screen.


Click the Globe icon to access the comprehensive O’Neil Database.
The O’Neil Database includes the entire catalogue of charted O’Neil instruments from all over the world. There are over 70,000 instruments in total, including over 50,000 global stocks.
The Ownership Database

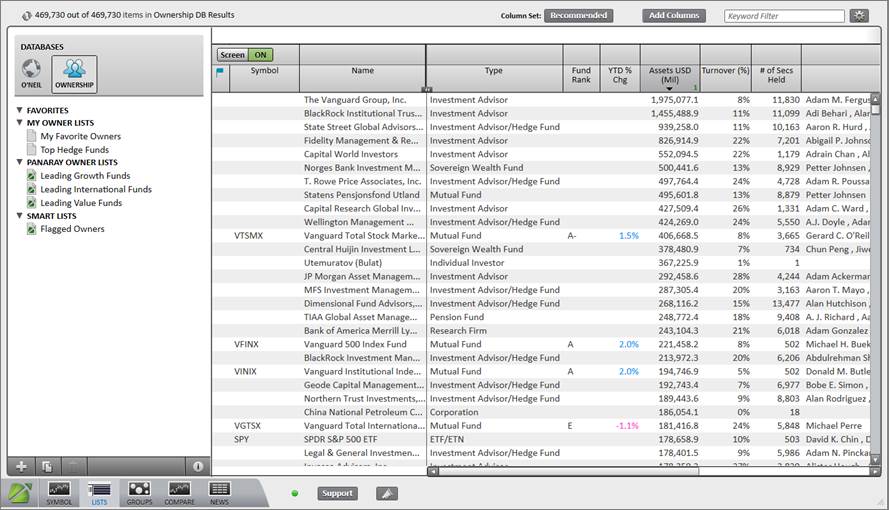
Click the Ownership icon to access the comprehensive Ownership Database.
The Ownership Database contains over 500,000 owners including funds, investment advisors, corporations, and individual investors.
Use the geography and groups filter to set a specific universe of geographical regions or industry groups. The filter applies to the entirety of List Manager and overrides any Column Set screens or filters. The blue text next to the geography and groups filter icon indicates which filters are on.

Click on the icon with the three black rectangles at the top of List Manager to open the geography and groups filter menu. Left click on options in the white boxes to select them. Use the Shift and Ctrl keys to highlight groups of items, and select or de-select individual items.
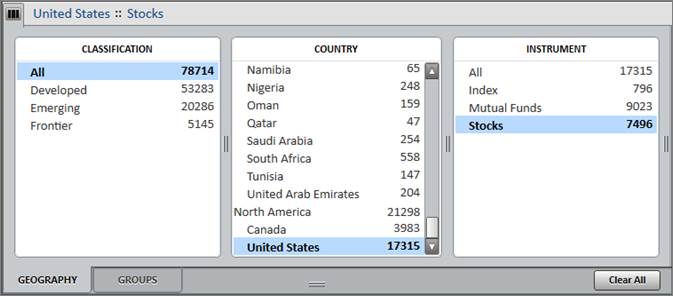
Click Clear All in the lower right corner of the menu to clear out all the filters.
Geography Filter
Click on the Geography tab to set a universe based on market classification, country or region, and/or instrument type.
Groups Filter
Click on the Groups tab to set a universe based on sectors, major industries, and/or industry groups.
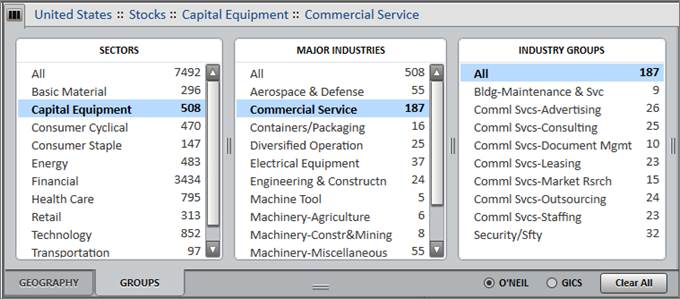
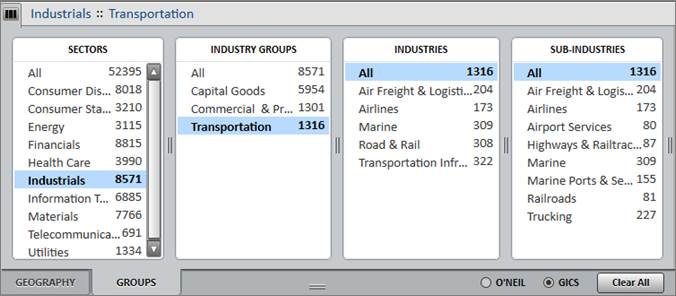
In the lower right corner of the menu, choose to see sectors and industries based on O’Neil Industry Groups or GICS® (Global Industry Classification Standard) Industries. GICS® Industries include selection options for sectors, industry groups, industries, and/or sub-industries.

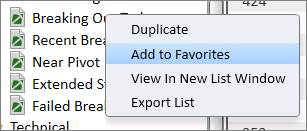
Lists that are manually favorited are compiled in the Favorites section.
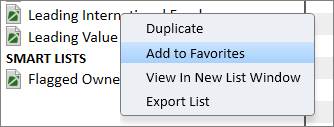
To add a list to Favorites, right click on that list and click Add to Favorites.

My Lists contains custom user lists.
To create a new list, click the plus (+) icon in the lower left corner and click New List. A white text box will appear to name the list under the My List section.
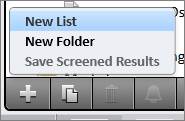
Click New Folder to create a folder to organize lists.
There are various ways to add single or multiple stocks to a custom list:
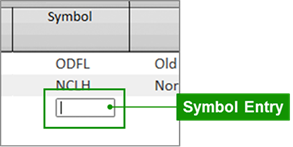
1. Manual Entry: Type the ticker symbol into the small box in the list’s Symbol column to manually add single stocks.
2. Copy/Paste: Highlight and copy a selection of symbols, right-click in the blank space of the list’s Name column, and click Paste. Stocks may be copied from within PANARAY, or from external applications (e.g. Microsoft® Excel® or Word®). In addition to the William O’Neil + Co. symbols, PANARAY recognizes additional identifiers including SEDOL Masterfile®, CUSIPS, Thomson Reuters ™, and Bloomberg ™ symbols.

SEDOL Masterfile® is a registered trade mark of the London Stock Exchange Group Plc
3. Drag and Drop: Drag and drop either a single stock, a highlighted selection of stocks, or an entire list of stocks from one PANARAY list onto a custom list.
4. Insert Key: Hit the Insert key while viewing a stock in Symbol View. Double-click on the desired list from the My Lists dropdown to add the current stock.
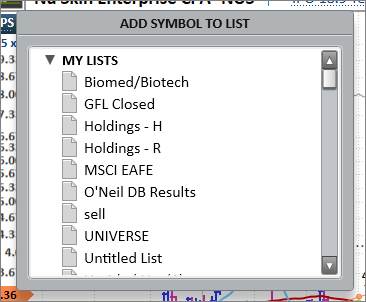
After adding stocks to a list, an action box will appear at the top of the screen indicating how many stocks were added, and if any are unable to be added. If any items are unable to be added, click the blue notification text to see a dropdown list of the faulty symbols. Click Undo in blue to immediately revert the stock additions.

To delete a stock from a custom list, right-click on a single stock or a highlighted selection of stocks and click Remove. Or hit the Delete key.
After removing stocks from a list, an action box will appear at the top of the screen indicating how many stocks were removed. Click Undo in blue to immediately revert the stock removals.

To duplicate an existing list, right click on the desired list and click Duplicate. This will create a duplicate list that resides in the My Lists section. Any list may be duplicated.

Or select the list and click the Duplicate icon on the bottom of the lists section.

To delete a list, right-click on the desired list and click Delete. Only custom lists from the My Lists section can be deleted.
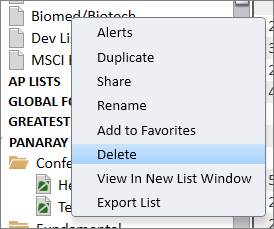
Or select the list and click the Trashcan icon at the bottom of the lists section.

List Alerts set specific alerts over an entire list of stocks. List Alerts may be set over My Lists, Portfolios, Global Focus Collection, or AP Lists. Set alerts on up to 10 different lists, each with up to 1,000 symbols. All List Alerts reset daily at 12:00AM Pacific Time.
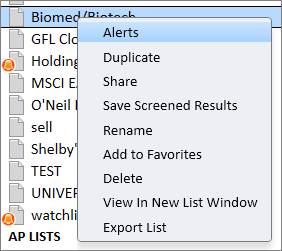
To set alerts over a list, right-click on the desired list and hit Alerts.
Or select the list and then click the Bell icon at the bottom of the lists section.

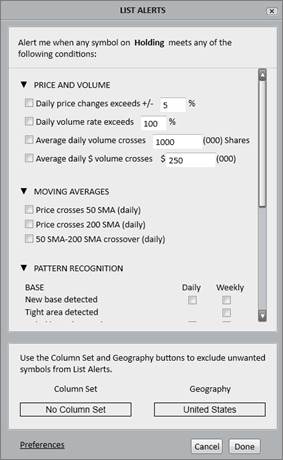
In the List Alerts menu, place a checkmark next to the item(s) to be alerted on.
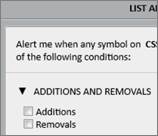
For Portfolios, AP Lists, and Global Focus Collection, there is an option to set Addition and Removal alerts. These options trigger an alert once a day signaling any stock additions or removals from the prior day.
Use the Column Set and Geography buttons to filter out certain stocks from the List Alerts. Please note that if using a Column Set filter, any changes to the Column Set will reflect in the alerts, regardless of where the Column Set was changed.

Once a List Alert is created over a list, a gray alert bell will appear next to the list name.

If any of the stocks in the list trigger an alert, the alert bell will turn orange, and the triggered stocks will be highlighted in orange.

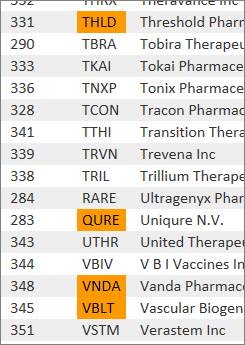
Hover the cursor over an orange highlighted symbol to see more details on the type of alert triggered.

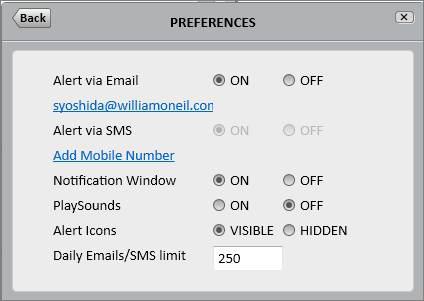
Click Preferences in the List Alerts menu to edit or change the alert Notification Preferences.

Choose to be notified in the application through sounds and pop-ups, or choose to be notified outside of the application through emails and SMS texts. Please note that notifications via email require verification of the address.
List Alert Limits
The daily Email/SMS limit defaults to 250 alert messages but can be changed via Notification Preferences. The daily maximum limit for email/SMS messages is 1,000.
List Alerts are limited to 10 lists and 1,000 stocks per list, based on the total stock count. If too many stocks are in a list when attempting to set a List Alert, a pop-up message will appear.
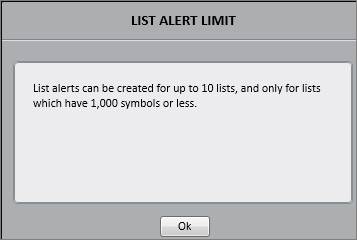
If too many stocks are added to a list with previously set alerts, the bell icon next to the list name will be crossed out to signal that the alerts are not active.

To share a custom My List, right click on the desired list and click Share.
Click Add Recipient(s) to choose colleagues to share the list with.
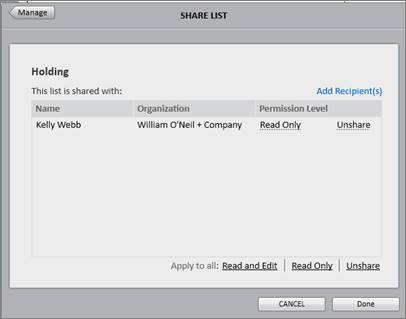
Choose between Read & Edit and Read Only permissions in the Permission Level column. Please note that any changes to lists with Read and Edit permission will be applied to all the shared users’ lists.
Manage shared items through the PANARAY Menu.
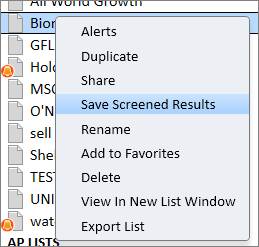
When a Column Set screen is run over a list, save the screened results to a new list by right-clicking on the desired list name, and hitting Save Screened Results
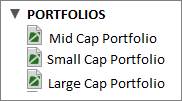
Lists that are uploaded using the Portfolio Utility tool are compiled in the Portfolios section. Clients can configure a script through a portfolio utility tool provided by William O’Neil + Co. These lists are available for any user set up by the portfolio administrator within each firm.
Portfolio Comparison is available for current Portfolios and provides a comparison of the selected portfolio to a set of benchmark ETFs that correlate to general market indices. The comparison metrics are based on the metrics from the current Column Set.
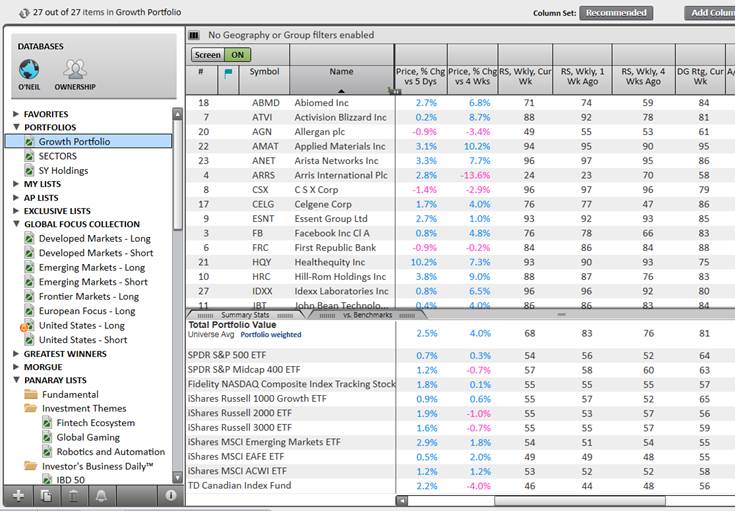
To enable Portfolio Comparison, click the Benchmarks tab at the bottom of List Manager.

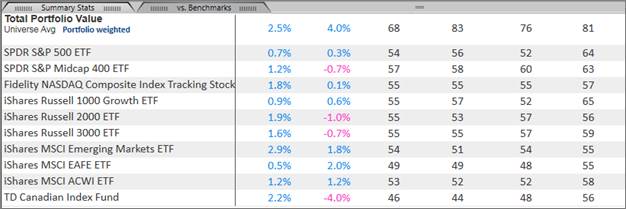
For both the Total Portfolio Value and Benchmarks, companies that do not have data for a specific metric are excluded from the calculation. Benchmark data is calculated using a simple average.
Total Portfolio Value
To change the Total Portfolio Value weighting, click the blue text to switch between Portfolio Weighted, Market Cap Weighted, and Equal Weighted.

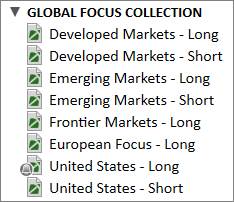
The Global Focus Collection contains lists of securities currently recommended by William O’Neil + Co.’s analyst team. Lists are divided and displayed according to country development classification, and position type.
Global Focus Collection lists are only available to those entitled to O’Neil research. Please contact William O’Neil + Co. for more information on these services.


The AP Lists and Exclusive Lists sections contain customized lists provided by William O’Neil + Co. as part of the Analytical Perspective (AP) or the Exclusive Focus List (XFL) product offerings. Clients can view these lists online, in print, or both.
AP Lists and Exclusive Lists are only available to those entitled to the AP or XFL service. Please contact William O’Neil + Co. for more information on these services.

The Greatest Winners lists contain the stocks that have formed the basis for the William O’Neil + Co. philosophy. The Lists are grouped by Decade and Model Themes.
Double-click on a stock in one of the Greatest Winners lists to view the Model Stock tab containing an in-depth case study and a Datagraph chart from the period of its historical bull run.
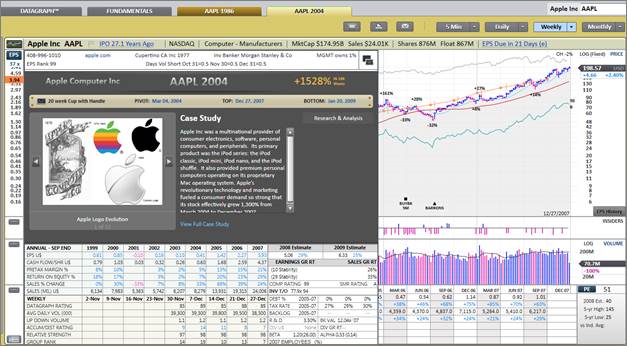
In Symbol View, stocks featured in the Greatest Winners lists are indicated by a gold Model Stock tab at the top.

The PANARAY Lists combine various performance lists for stocks, industry groups, market data, and economic indicators. Lists update each day automatically.
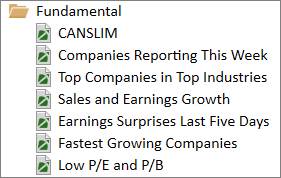
The Fundamental lists contain dynamic preset screens based on fundamental metrics.
CANSLIM
The CANSLIM list contains stocks which may have above average investment potential including EPS changes, O’Neil proprietary ratings, institutional ownership, and price/volume characteristics.
Companies Reporting This Week
This list contains companies reporting their earnings within the next five trading days from the current date.
Top Companies in Top Industries
This list shows stocks with a market capitalization over $100 million that are in the top 10% of the William O’Neil + Co. 197 Industry Groups and have strong O’Neil ratings.
Sales and Earnings Growth
This list contains stocks with consistent sales and earnings growth, as well as stability. These stocks also have a strong EPS Rank and a market capitalization over $100 million.
Earnings Surprises Last Five Days
This list shows all companies that have reported earnings in the last five trading days with current earnings and estimate data.
Fastest Growing Companies
The Fastest Growing Companies list shows the top 100 companies traded on NYSE, AMEX, or OTC according to their five-year earnings growth rate.
Low P/E and P/B
This list contains value-oriented stocks with low price to earnings, price to book, and price to equity ratios. Stocks in this list also have consistent sales and earnings growth rates.

This folder contains all the major stock lists available in the Investor’s Business Daily® newspaper.
IBD® 50 List
The IBD® 50, which runs in the Monday edition in the IBD® newspaper, is a computer-generated ranking of leading companies trading in the US. Rankings are based on a combination of each company’s profit growth; IBD® newspaper’s Composite Rating, which includes key measures such as return on equity, sales growth, and profit margins; and relative price performance in the last 12 months.
IBD® 85-85 List
The 85-85 Index, which runs in the Friday edition in the IBD® newspaper, is a computer-generated stock list generated based on the following criteria: 1) price above $15; (2) stock price within 15% of its 52-week high; 3) EPS and Relative Strength rating of 85 or greater; 4) average daily dollar trading volume of 10,000 shares or more.
IBD® Big Cap 20
The IBD® Big Cap 20, which runs in the Tuesday edition in the IBD® newspaper, is a computer-generated ranking of the leading large-capitalization companies trading in the US. Rankings are based on a combination of each company’s profit growth; IBD® newspaper’s Composite Rating, which includes key measures such as return on equity, sales growth, and profit margins; and relative price strength in the past 12 months.
IBD® New America
The IBD® New America Index tracks all the stocks of companies covered in IBD® newspaper’s “The New America” section, for six months.

Use the lists in the Industry Groups folder to look up an industry group’s rank, nominal price performance, rotation, market capitalization, proprietary O’Neil Industry Group rating, and other miscellaneous data.
GICS® Constituents
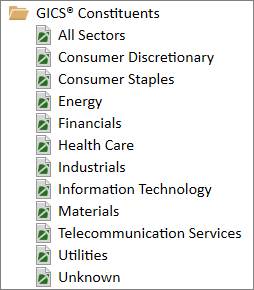
The O’Neil Database can be sorted by GICS® (Global Industry Classification Standard) Constituents. GICS® provides a breakdown by Sector, Industry Group, Industry, and/or Sub-Industry.
O’Neil 197 Industry Groups
This list contains the global O’Neil Industry Groups along with current and historical Group Rank. Double click on an industry group to display the industry group Datagraph in Symbol view.
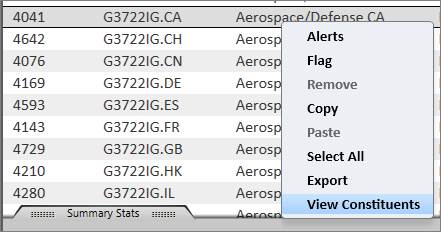
Right-click on an industry group and select View Constituents to view the constituent stocks in a separate list:

Use the IPO lists to access data on recent and upcoming Initial Public Offerings (IPOs).
Upcoming IPOs
This list shows companies that will soon be publicly available. The user can access information about companies such as the O’Neil Industry Group it will fall under, market value, investment banker, new issue price, and year-over-year EPS and sales changes.
Recent IPOs
This list shows companies whose stock is over $5 and had a recent IPO.
Top Performing IPOs
This list shows companies that are top performers and have been made public in the last two years. The list shows proprietary ratings and rankings along with fundamental and technical data items.
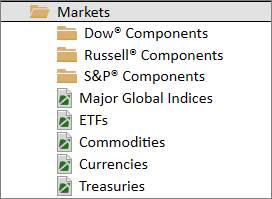
Use the Markets lists to access and screen on the constituent equities of the major U.S. market indices. The Markets folder also includes most major non-US indices, ETFs, and other market-moving economic indicators.
Dow® Components
These lists display the components of the Dow® indices. Choose All Components or narrow it down to a specific index such as Dow® Industrials, Dow® Transportation, or Dow® Utility.
Russell® Components
These lists display the components of the various Russell® indices.
*Access to the Russell® indices requires an entitlement. Please contact William O’Neil Client Services for more information, or to request verification to view the components.
S&P® Components
These lists display the components of the S&P indices. Choose All Components or narrow it down to a specific index such as S&P 100, S&P 500, S&P 400 Midcap, or S&P 600 Smallcap.
Copyright © 2015, Standard & Poor's Financial Services LLC, all rights reserved
Other Indices and Economic Indicators

In addition to index-based research, the other Markets lists allow access to price performance on most major non-U.S. indices, ETFs, and other market-moving economic data such as commodities, currencies, and treasuries.
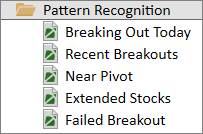
The Pattern Recognition lists scrub the global O’Neil Database utilizing our Pattern Recognition algorithms. All the lists are based on Weekly patterns and consist of stocks with a minimum average volume of 100,000 and a minimum price of $10.
Breaking Out Today
Companies whose stock price has reached/surpassed the pivot point on a Weekly Base during the current trading day for domestic stocks and prior trading day for international stocks.
Recent Breakouts
Companies whose stock price has reached/surpassed the pivot point on a Weekly Base within the past 15 days (16 days for international stocks) and has not declined more than 7% from the pivot price since reaching the pivot.
Near Pivot
Companies whose stock price is within 5% of the pivot point on a Weekly Base.
Extended Stocks
Extended stocks are more than 25% above the pivot price without ever undercutting the pivot and at least 15 days but less than 1 year have elapsed since the pivot price. These stocks are also above their 50-day moving average and near a new 52-week high.
Failed Breakout
Companies whose stock price is trading 7% or more below the pivot price.
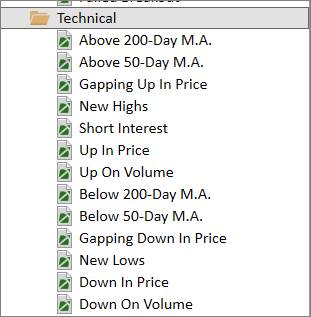
The Technical Lists contain dynamic preset screens based on technical metrics.
Above 200-Day M.A.
Stocks with current day’s price above the 200-day moving average price. The list is sorted by volume rate and includes stocks from all exchanges that are at least $5.
Above 50-Day M.A.
Stocks with current day’s price above the 50-day moving average price. The list is sorted by volume rate and includes stocks from all exchanges that are at least $5.
Gapping Up in Price
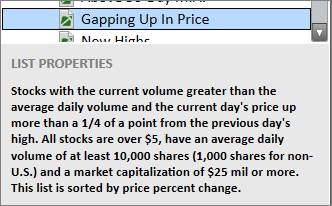
Stocks with the current volume greater than the average daily volume and the current day’s price up more than 1/4 of a point from the previous day’s high. All stocks are over $5, have an average daily volume of at least 10,000 shares (1,000 shares for non-U.S.), and a market capitalization of $25,000,000 or more. This list is sorted by price percent change.
New Highs
Stocks with the current day’s high price greater than the 52-week high price
Short Interest
Provides the total short volume and the number of days to cover short interest based on the average daily volume. The number of days to cover short interest is provided for each of the last three periods. This list is sorted by the number of days to cover short interest for the most recent period.
Up in Price
Stocks with the current day’s price percent change up at least three percent from the previous day’s close. All stocks are over $5, have an average daily dollar of at least 10,000 shares (1,000 shares for non-U.S.) and a market capitalization of $25,000,000 or more.
Up on Volume
Stocks with the current volume percent change of at least 20% and the current day’s price up 1/4 of a point or more. All stocks are over $5, have an average daily dollar of at least 10,000 shares (1,000 shares for non-U.S.) and a market capitalization of $25,000,000 or more.
Below 200-Day M.A.
Stocks with current day’s price below the 200-day moving average price. The list includes stocks from all exchanges that are $5 and over and is sorted by price percent change.
Below 50-Day M.A.
Stocks with current day’s price below the 50-day moving average price. The list includes stocks from all exchanges that are $5 and over and is sorted by price percent change.
Gapping Down in Price
Stocks with the current volume greater than the average daily volume and the current day’s price down more than 1/4 of a point from the previous day’s low. All stocks are over $5, have an average daily volume of 10,000 shares (1,000 shares for non-U.S.) and a market capitalization of $25,000,000 or more. This list is sorted by price percent change.
New Lows
Stocks with the current day’s low price less than the 52-week low price.
Down in Price
Stocks with the current day’s price percent change down at least three percent from the previous day’s close. All stocks are over 45, have an average daily volume of at least 10,000 shares (1,000 shares for non-U.S.) and a market capitalization of $25,000,000 or more.
Down on Volume
Stocks with a current day’s price down at least 1/4 of a point from the previous day’s close and a current volume percent change of at least 20%. All stocks are over$5, have an average daily volume of at least 10,000 shares (1000 shares for non-U.S.) and a market capitalization of $25,000,000 or more.
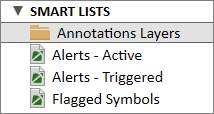
Smart Lists compile all stocks that have been manually marked for further review with Annotations, Alerts, and/or Flags.
Any stocks that have annotations drawn on the chart are listed under the Annotation Layers Smart List. The default Recommended column set shows the number of annotations on that stock chart, and the date the last annotation was added.
Any stocks that have active alerts set on them are listed under the Alerts – Active Smart List. The default Recommended column set shows the percentage to upside/downside, the number of active alerts, and the date that the last created alert was edited.
Any stocks that have previously triggered alerts are compiled under the Alerts – Triggered Smart List. The default Recommended column set shows the number of triggered alerts and the date that the alert was last triggered.
The Flagged Symbols list compiles all symbols that have been manually flagged in PANARAY. There are various ways to flag stocks from different areas of PANARAY.
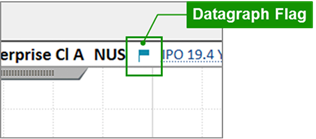
1. Datagraph Flags: Click the flag icon in the chart heading to flag a stock via the Datagraph.
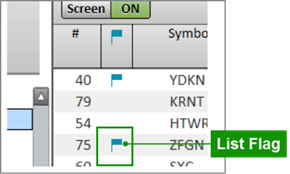
2. List Manager Flags: Click the blank area under the flag column to flag a stock via List Manager.
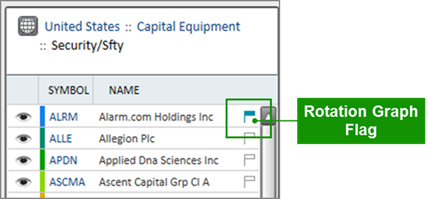
3. Rotation Graph Flags: On the Stock Rotation Graph, click the flag icon next to the company name, or right-click on a stock tadpole to flag via Groups.
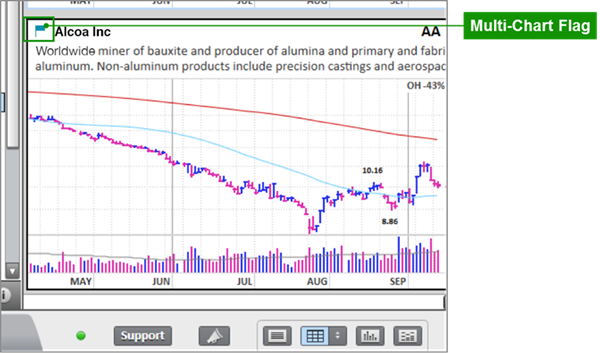
4. Multi-Chart Flags: Click the flag icon next to the company name to flag a stock in Multi-Chart view located within List Manager.
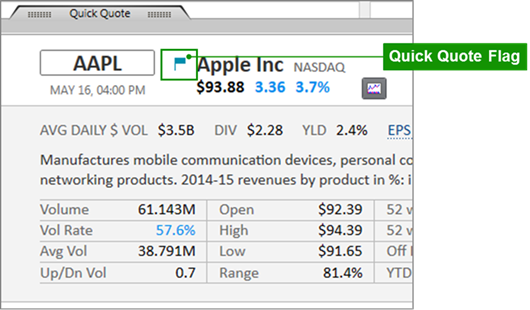
5. Quick Quote Flag: In the Quote Board view of List Manager, click the flag icon in the Quick Quote section located within List Manager.
Lists may be shared within the same firm or with William O’Neil + Co. Institutional Client Services. To share a list, right-click on the desired list and click Share. Any lists shared by colleagues are compiled in the Shared Lists section.
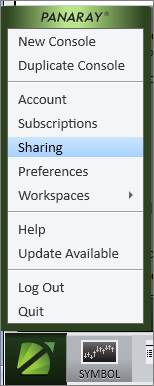
Shared items can be managed through the PANARAY Menu in the lower left corner on of the screen.
 .
.

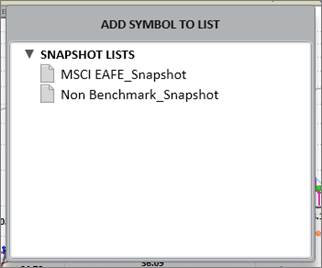
Snapshot Lists compile all saved Snapshots. Snapshots show historical Datagraphs with a specific chart end date.
To create and save a Snapshot Datagraph, use the Change Date or Mountain Chart to find the preferred chart end date, and then hit the Insert key. Double click on a Snapshot List to add the current stock Snapshot.
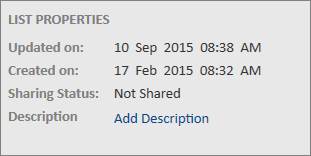
Click on the information icon at the bottom of the lists to see a description of the currently selected list’s properties.

For automatically generated PANARAY lists, the description will display the parameters used to create it.
For custom My Lists, the description will display the date the list was created, the last date it was updated, its sharing status, and an option to manually input a description.
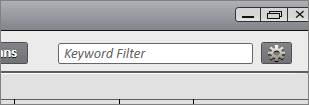
Use the Keyword Filter box to search for a keyword or portion of a keyword in the current List Manager view. Type into the search box and hit Enter on the keyboard to see all items that match the keyword filter.
Please note that the keyword filter requires letters. Numbers are not recognized by the filter.
Click the gear icon in the top right corner of List Manager to access List Manager Settings.

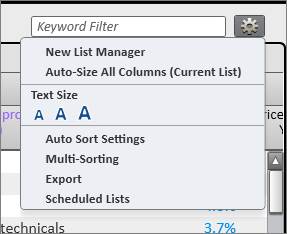
New List Manager
Open another PANARAY console for List Manager. Choose to view any list in a new console by right-clicking on the list name and clicking View in New List Window.

Auto-Size All Columns (Current List)
Automatically resize the columns to the optimal width for each metric in the current Column Set.
Text Size
Choose between small, medium, and large List Manager text size.
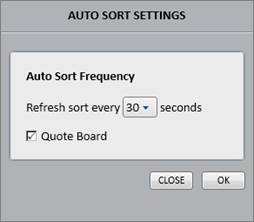
Auto Sort Settings
Set the auto sort frequency for the Quote Board. Auto sort automatically refreshes the list sort for users with Nasdaq Basic SM real-time pricing.
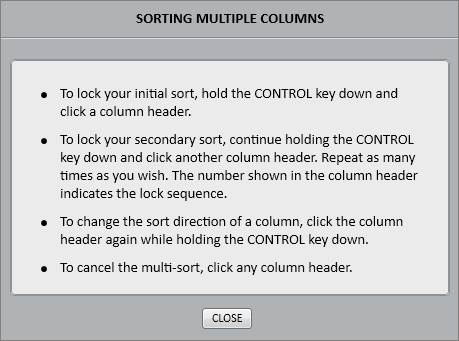
Multi-Sorting
See details on sorting multiple columns.
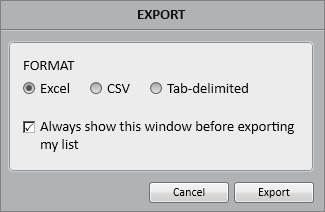
Export
Export the current list. Lists can also be exported by right-clicking on the list name and clicking Export.
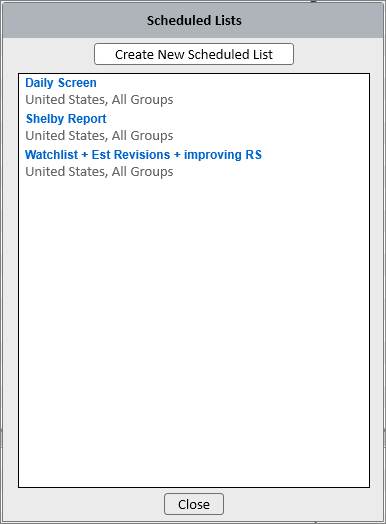
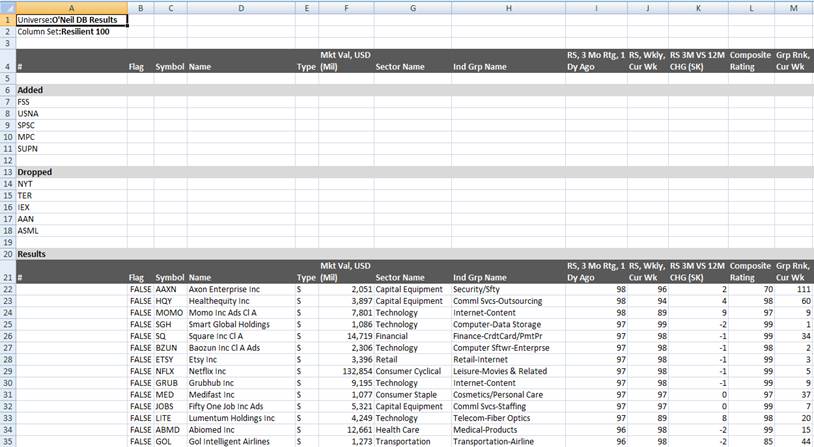
Scheduled Lists allow users to automatically run a column set on any given day / time and have the results emailed and saved as a list in PANARAY. Column sets can be run against any given universe including existing saved lists. Emailed results include sections for “Added and Dropped”. The current stock results are compared to the previous scheduled list to determine which stocks were added and removed.
The Scheduled Lists Menu contains any Scheduled Lists that may have been set up. To create a new one, click Create New Scheduled List.
The New Scheduled List Menu contains options to customize the Scheduled List properties and delivery method.
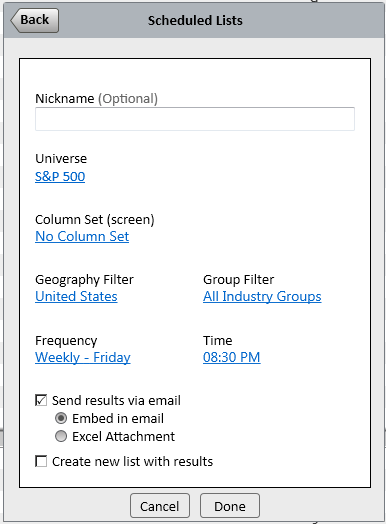
Nickname
Nickname is optional. This name will appear in the email sent, the List Name displayed in the main Scheduled Lists window, and in the new My List if you elect to have a PANARAY list created.
Universe
Set the Universe for the Scheduled List.
Column Set (screen)
Set a Column Set to run over the list. This can also be left empty to simply get list results sent.
Geography and Group Filter
Set a specific geography or industry group filter.
Frequency
Scheduled Lists can be set up daily or weekly on a specific day of the week.
Time
Set a time for the Scheduled List to run.
Scheduled List Delivery
Scheduled List results can be sent via email and/or created as a new list in PANARAY. For emailed alerts, choose to have the results embedded in an email, or sent as an Excel attachment.
Embedded email alerts will show the symbol results and which stocks were added or removed since the last Scheduled List.
Excel Attachment email alerts will show the symbol results along with the full Column Set and which stocks were added or removed since the last Scheduled List.
Results created as a new list will create a new PANARAY list using the Scheduled List Nickname if applicable. The list will be timestamped and the results will display alphabetically with the Recommended Column Set.
Please note that to send Scheduled List results via email, Scheduled List Alert Emails will need to be enabled through PANARAY Notification Preferences.

Email Attachment format example:
The Ownership Database contains over 500,000 owners including funds, investment advisors, corporations, and individual investors. Use the database within List Manager to create and organize owner lists, screen on owner lists, and view owner holdings.
Click the Ownership Icon to access the comprehensive Ownership Database.


To add a list to Favorites, right click on that list and click Add to Favorites.
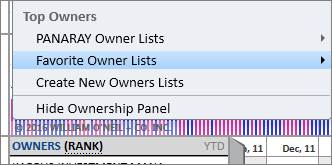
Use Favorite Owner Lists to customize the list of owners that appear in the Ownership Block on the Datagraph. With the Ownership Block enabled, click Owners in blue, and then select a Favorite Owner List. The numerical order of symbols in the Favorite Owner List is the order that they will appear in the Block.
My Owner Lists contains user-created owner lists.
To create a new list, click the plus (+) icon in the lower left corner and click New List. A text box will appear to name the list. The list will now reside alphabetically in the My Owner Lists section.
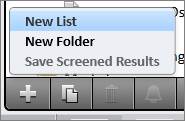
Click New Folder to create a folder to organize owner lists.
There are various ways to add single or multiple owners to a user-created My Owner List:
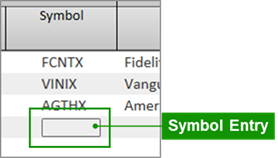
5. Manual Entry: Type the ticker symbol into the small box in the list’s Symbol column to manually add single symbols.
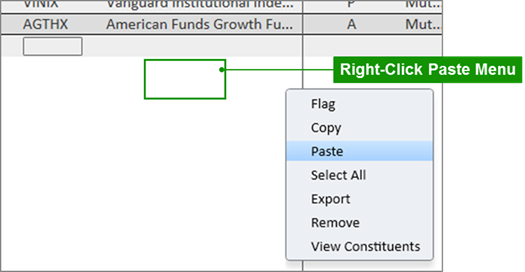
6. Copy/Paste: Highlight and copy a selection of symbols, right-click in the blank space of the list’s Name column, and click Paste. Symbols may be copied from within PANARAY, or from external applications (e.g. Microsoft® Excel® or Word®). Please note that in addition to the William O’Neil + Co. symbols, PANARAY recognizes additional identifiers including SEDOL Masterfile®, CUSIPS, Thomson Reuters ™, and Bloomberg ™ symbols.
SEDOL Masterfile® is a registered trade mark of the London Stock Exchange Group Plc
7. Drag and Drop: Drag and drop a single owner, a highlighted selection of owners, or an entire list of owners from the search results or from one PANARAY list onto another.
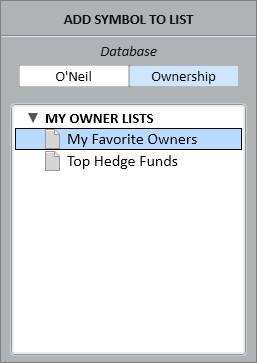
8. Insert Key: Hit the Insert key on the keyboard while viewing an owner Datagraph in Symbol View. Select either the O’Neil or Ownership Database to bring up their respective lists. Double-click on the desired list from the dropdown to add the current symbol.
After adding owners to a list, an action box will appear at the top of the screen indicating how many were added, and if any are unable to be added. If any items are unable to be added, click the blue notification text to see a dropdown list of the faulty symbols. Click Undo in blue to immediately revert the owner additions.

To delete an owner from a custom My Owner List, right-click on a single symbol or a highlighted selection of symbols and click Remove. Or hit the Delete key.
After removing owners from a list, an action box will appear at the top of the screen indicating how many were removed. Click Undo in blue to immediately revert the owner removals.

To duplicate an existing list, right click on the desired list and click Duplicate. This will create a duplicate list that resides in the My Lists section. Any list may be duplicated.
Or select the list and click the Duplicate icon on the bottom of the lists section.

To delete a list, right-click on the desired list and click Delete. Only custom lists from the My Owner Lists section may be deleted.
Or select the list and click the Trashcan icon at the bottom of the lists section.

The PANARAY Owner Lists are automatically generated and updated based on owner characteristics.
The Flagged Owners list compiles all owner symbols that have been manually flagged in PANARAY.
The Metric Library and Column Sets are unique to the Ownership Database. The Metric Library contains metrics tailored to viewing owners. Column Sets are specific to their respective database and will not appear across databases.